Saturday, October 10, 2009

Act 19: Restoration of blurred image

In this activity, we blur and noise an image, and using the knowledge of the process involved in the degradation of the image, we attempt to restore it.

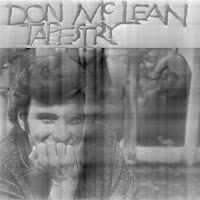
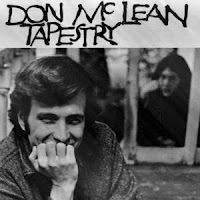
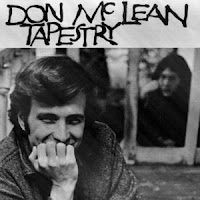
First, we make use of this image

(source: http://www.misterguitar.us/news/images/tapestry1969.jpg)

We then degrade the image by blurring, which is governed by

where a and b are the total respective x- and y- displacement.
and adding Gaussian noise, using (grand, 'nor' function in Scilab), whose Fourier transform is represented as N(u,v). The degraded image is obtained from the equation

where F(u,v) is the Fourier transform of the original image.

We now try to vary the parameters and see the resulting image. First, we hold T=1, and vary a and b, a=1 b=1, a=0.1 b=0.1, a=0.01 b=0.01, a= 0.001 b=0.001. The resulting respective images are shown below.

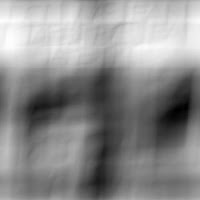
It can be seen that as a and b are increased the image becomes less blurred, and the features become discernible once again.

This time we hold a=0.01 b=0.01, and vary T, T=0.001, T=0.01, T=0.1, T=1, T=10, T=1000
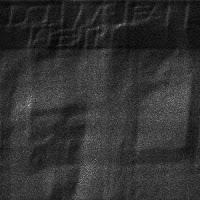
It can be seen that the image inverts at small T, while it reverts and approach a certain threshold as T is increased.

Next, we attempt to reconstruct the image using Weiner filtering.

where


Since the power spectrum of the undegraded image is known, we can use this filtering. We make use of the image a=0.01 b=0.01 T=1

Note that the above is only applicable when the power spectrum of the undegraded image is known, i.e. we have the original image at hand. Supposing it is unkown, we can guess a good value by letting the ratio of the power spectra become K, an arbitrary constant. In equation form:

Making use of K=0.1, K=0.0001, K=0.000001, we obtain these images
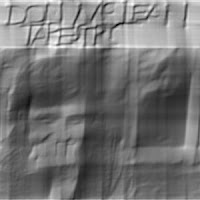
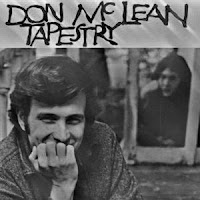
It can be seen that decreasing K improves the image, thus the ratio of the power spectra must be small.

I will give myself a grade of 10/10 for completing this activity. Again, I would like to thank Earl for the cooperative effort, and Gilbert for showing me that (1.)/ is correct for matrix inversion instead of just 1./.

Wednesday, September 16, 2009

Act 18: Noise models and basic image restoration

In this activity, we make use of a grayscale image, apply noise to it, and using knowledge of the noise present in the image, try to recover its quality.

We make use of the image similar to the one provided in the Activity 18 manual and its pdf (above), as well as an image downloaded from the internet and its pdf (below):


Source: (http://www.stevennoble.com/closer_look/SLS_Corporate_Logo_th.jpg)

We apply different kinds of noise to it.
Gaussian:


Rayleigh:


Erlang or gamma:


Exponential:


Uniform:


Impulse or "salt and pepper":


Since the noises in the images were applied onto an original image, we try to reconstruct the images using four kinds of filters which are suited for additive noises. These are arithmetic mean filter, geometric mean filter, harmonic mean filter, and contraharmonic mean filter. Applying these filters for each image will yield the following (note that the images are sequenced in the with respect to the sequence of the filters mentioned above):

For the Gaussian noise:
Arithmetic

Geometric

Harmonic

Contraharmonic


(For the next sets of images, the order of the filter used follows suit.)
For the Rayleigh noise:


For the Erlang noise:


For the exponential noise:


For the uniform noise:


For the impulse noise:


It can be seen from the resulting images that the filters yielded somewhat similar reconstructions, save for the contraharmonic filter (where Q=2) which yielded images that had inverted colors. The harmonic and geometric filters had similar reconstructions. It is interesting to note that both images reconstructed using these two filters had black dots scattered at some parts of the image. Also, a subtle difference between the two is that the harmonic image is a bit darker. The arithmetic filter seems suitable for most applications in general; the images yielded by this filter looks fine in most cases.

We now investigate the effects of varying the order of the filter Q in the salt-and-pepper noise.
For Q=2 and Q=-2:

For Q=1 and Q=-1:

For Q=0.1 and Q=-0.1:

For Q=0.01 and Q=-0.01:

It can be seen that the contraharmonic filter attempts to mask the "pepper" noise by applying white patches on it when Q is positive, while the reverse happens for when Q is positive. Long blog is long. These patches become larger when the absolute value of Q is increased, but is barely noticeable when set too low. Based on my observation, it is better to eliminate "pepper" noise, since black on a grayscale image is more discernible.

I will give myself a grade of 10/10 for this activity since I have completely done all the steps. I would like to thank Earl for his help with the filters and Gilbert for providing me with the modnum toolbox necessary to generate Rayleigh noise.